There are many different ways to approach this problem, but today I want to show you a relatively new method using Google Fusion Tables. (If you don't know what a Fusion Table is, it's basically a spreadsheet that has a lot of smarts built into it--you can merge multiple tables together intelligently, and visualize the contents of the sheet, which is what we'll be doing here today.)
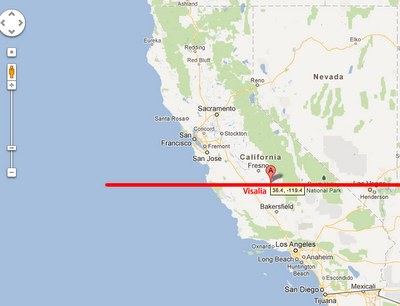
First, let's get a sense for where our dividing line is. I went to Google Maps and snapped the following image, then drew in a red-line dividing north from south, a Mason-Dixon line of California, if you will. (You can see also the little yellow box indicating the lat/long of Visalia.)
So now, how do we find a list of the EPA's Superfund and brownfield sites?
The approach I took was to use the (relatively) new Google Table Search. http://www.google.com/fusiontables/search Once there, I did the obvious search:

And if you visit the web page, you'll see it's the master list of the Superfund and Brownfield sites, exactly what we're looking for.

If you click on the "Show more" link, you'll see what kind of content the Table Search engine has extracted (which is pretty much exactly what's on the web page). This means we're 90% of the way there.

Clicking on the link takes you to that data as imported into a Fusion Table. You'll see that the table has the three columns just as in the EPA's original data set: location, site name, type (brownfields or Superfund).
Now that you have the table, you can GEOCODE the contents of the table by selecting "geocode" under the File menu on the table.

That step converts each of the place-name references into a discrete location (in terms of lat/longs) that can then be automatically placed onto the map of California by using the Visualize>Map option.

Once you do this step, you've got a little data cleanup to do because not all of the rows can be neatly geocoded (that's what the yellow highlighting means in table below--"not geocodable"). That's what you'd expect from the "A | B | C ..." (which appeared in the original table to provide jump links to sections in the data, but aren't useful here). Still, a few places (e.g., Alpine County) in the image below, should have been converted--you'll just have to bear that in mind when we do our count.

Then, switching to a map visualization of the data and just doing a quick count of the dots on the visualized map, I found 108 sites on the Visalia latitude or north, but I found 83 south of our dividing line.
Of course, there should be a be better way to do this (but I'll leave that for a future post).
Then it's an easy step to count the brownfields and Superfund sites row-by-row. I found 124 Superfund sites and 66 brownfield sites.
But unfortunately, this is a contest that I, as a northern Californian, didn't want to win. The north has significantly more sites: 108 in the north, 83 in the south.
Note: If you read through the reader comments, you'll find several other ways to solve this problem. Several people pointed out some very nice maps that the EPA has already drawn. And, unfortunately, not all of the data is mutually consistent. That's partly because different data sets draw on different EPA resources at different times (the list changes). But if you look through it all, the conclusion is more-or-less the same.
Good Day, Dr. Daniel.
ReplyDeleteAs always I learned new things. Thank You.
Altought I knew about Google Table Search, never thought about that in this search and also didn´t know all the things this tool can do. I tried looking csv, xls and many more and with not luck.
In counting for me Alt+f was easy. But couldn´t find a way to put the sites on a map. Now I know how!
One question. What is the answer to the extra credit question and how you find the answer? that is still open for research?
Best Regards José Ramón
Now that is some cool research. I did not know about fusion tables or how to use them. Thanks, I knew the answer was in those long EPA files but did not know a way to "easily" extract the answer.
ReplyDeleteHow about a future class on use of fusion tables?
And I see that there are tutorials at:
ReplyDeletehttp://www.google.com/fusiontables/Home/
I am sure the answer to the second part can be extracted using the tables functions, after finding the right table with cost. Or ...
G